


[latexpage]
This article aims to extend the analysis of Bitcoin using Metcalfe’s Law performed by Cryptolab Capital on this article. Here, we are going to summarize some ideas and apply them to other major networks. We are going to update the analysis with Bitcoin to review some points and then, we are going to extend the analysis to Ethereum, Ripple, EOS, Cardano and Stellar.
Metcalfe’s & Odlyzko Law
Metcalfe’s law was introduced in our previous article. Metcalfe’s law states the effect of a telecommunications network is proportional to the square of the number of connected users of the system:
\begin{equation}
net \propto (U)^2
\end{equation}
Dr. Ken Alabi showed that blockchain networks like Bitcoin, Ethereum and Dash appears to be following Metcalfe’s Law, using Daily Active Addresses (DAA) as network nodes. Early this year, Cryptolab Capital also used Metcalfe’s Law to estimate whether Bitcoin prices are supported by activity on the network. They developed a series of interesting metrics that also include Odlyzko’s law. The last one, proposes that the value of the network is proportional to the amount of network nodes multiplied by their logarithmic value:
\begin{equation}
net \propto (U)\cdot log(U)
\end{equation}
Odlyzco emphasizes that the Metcalfe law overestimates the use of the network. Based on these assumptions, Cryptolab Capital uses both frames to analyze lower and upper bounds of Bitcoin historic market capitalization.
Bitcoin
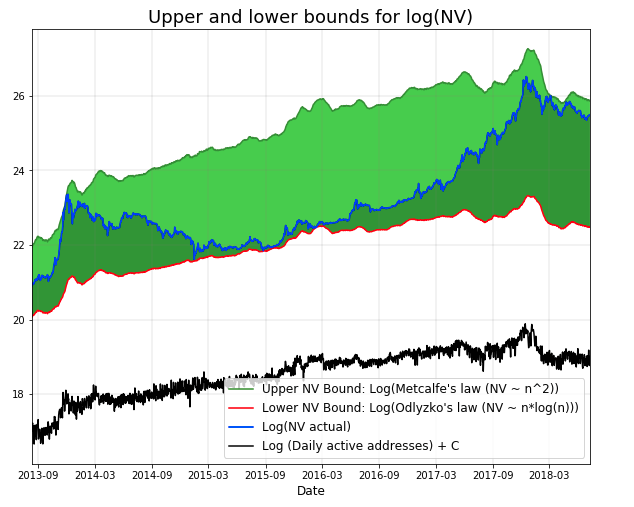
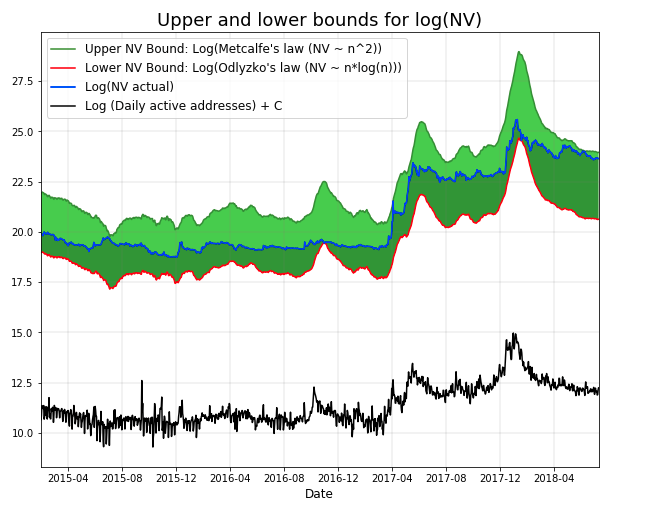
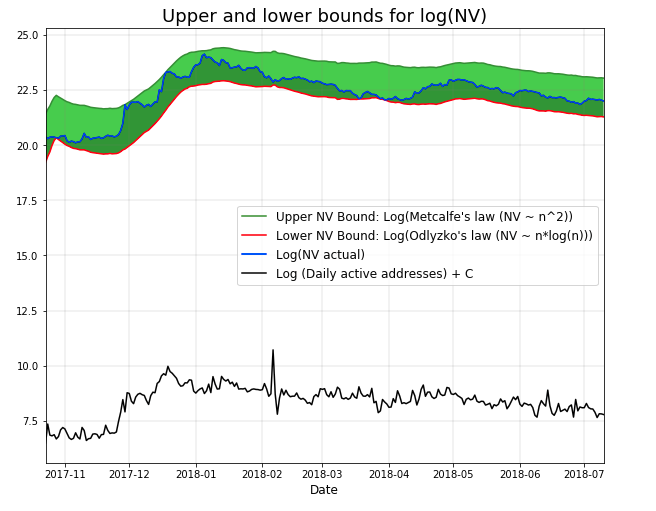
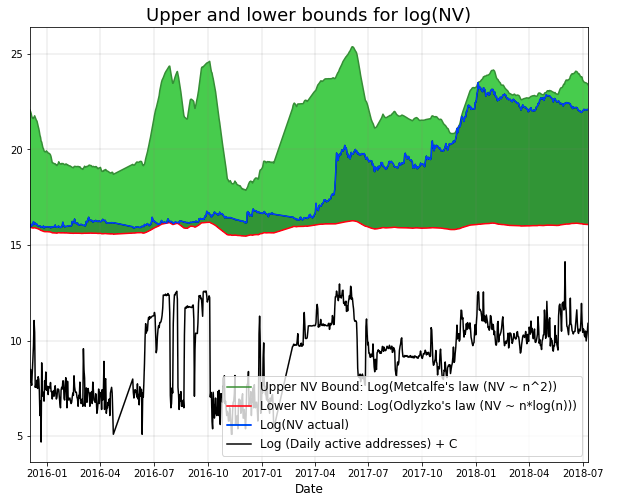
In the following analysis, lower and upper bounds for the historic Bitcoin market capitalization have been build using Metcalfe’s and Odlyzko’s law respectively. The proportionality constants have been calculated in order to minimize the area between curves using lagrange multipliers (thanks Matías for the mathematical tips). The following chart shows the historic Bitcoin market capitalization in logarithmic scale and upper and lower bounds calculated. Every time the market capitalization approaches the upper bound there is a following correction. It’s also plotted the DAA curve (also in logarithmic scale and shifted) to be helpful to compare.
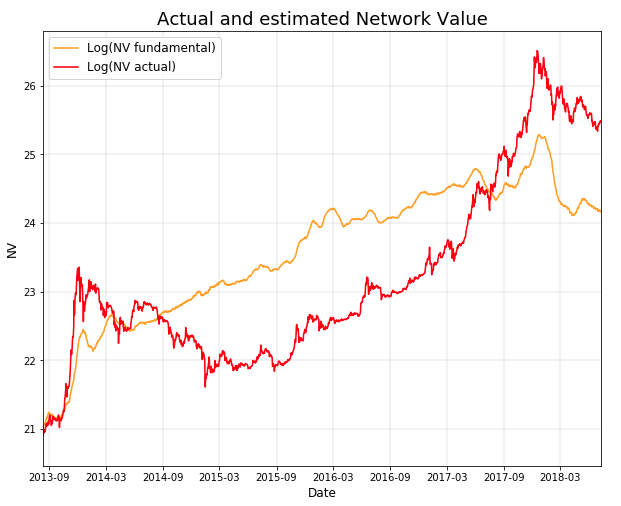
Once upper and lower bounds are calculated, Cryptolab Capital propose to compute a valuation of the network as the half-sum of these bounds. The Metcalfe estimated fundamental Bitcoin value (NV fundamental) is plotted below with Bitcoin market capitalization (NV actual). We can appreciate a narrow relationship between both curves.
The Network Value to Metcalfe (NVM) metric consists in the difference between them:
\begin{equation}
NVM=ln(NV_{actual}) – ln(NV_{Metcalfe}) = ln\left ( \frac{NV_{actual}}{NV_{Metcalfe}}\right )
\end{equation}
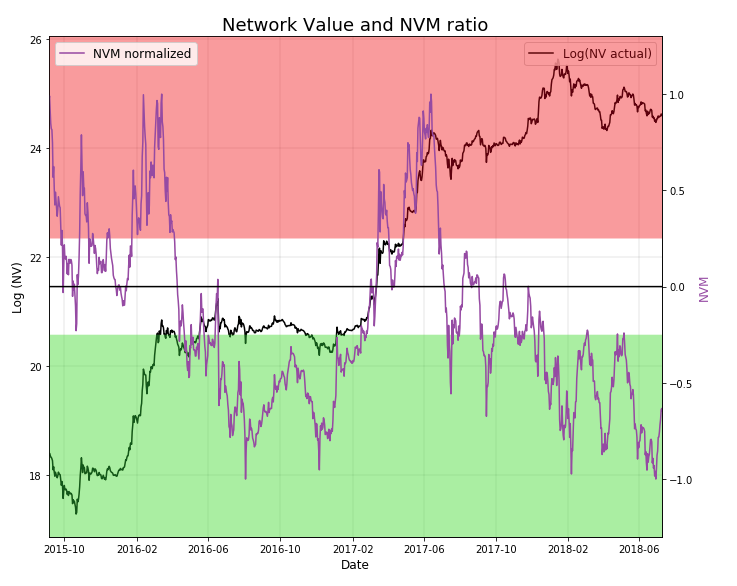
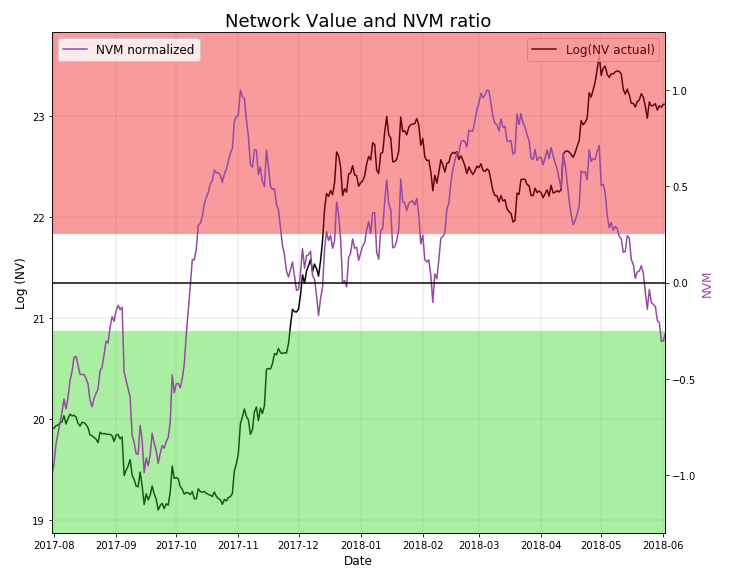
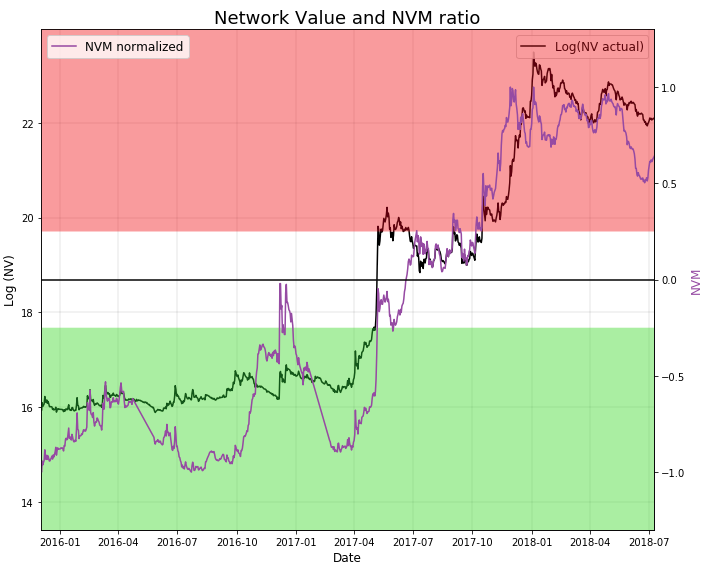
The NVM normalized is plotted below with market capitalization, in logarithmic scale again. We have defined arbitrarily cuts in +/- 0.25 in such a way that we can visually inspect periods in which NVM is too low or too high, predicting possible corrections.
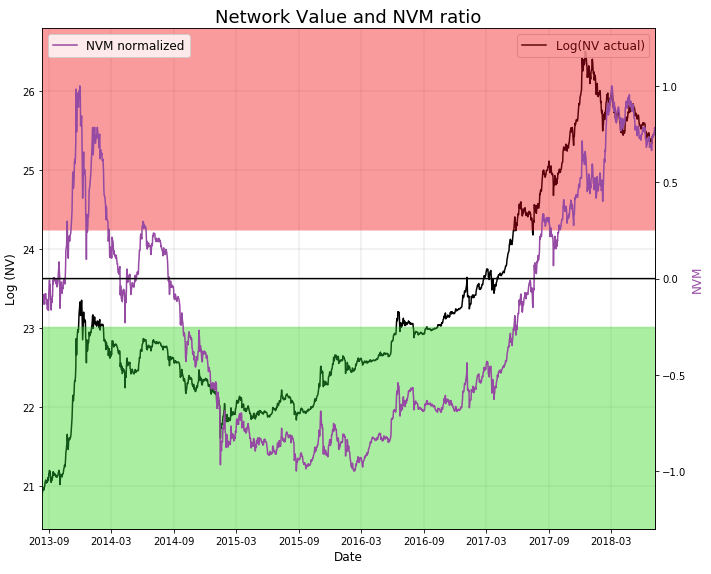
Inspecting the chart, we realize Bitcoin continues in the upper bound. It’s possible that NVM will revert. This may happen due to another future fall in bitcoin prices (a decrease in the NVM numerator), but it can also happen if daily active addresses grow, (which would increase the denominator). So, it’s still to early to determine whether we are in a bubble, or in the first steps of the Bitcoin massive adoption.
In the following sections we apply the previous methodology to analyze Ethereum, Ripple, EOS, Cardano and Stellar networks.
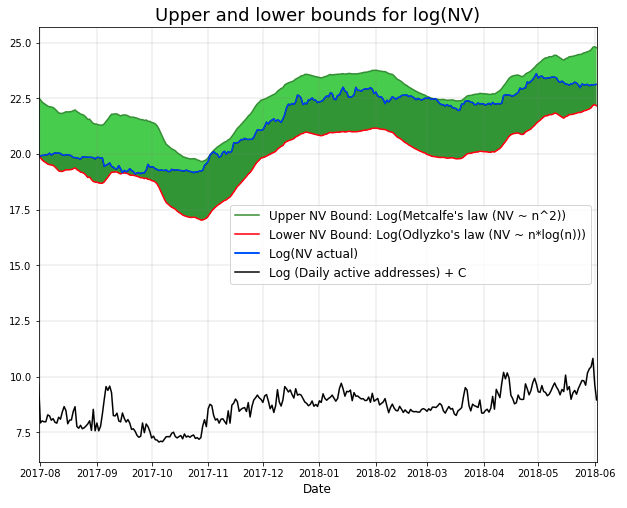
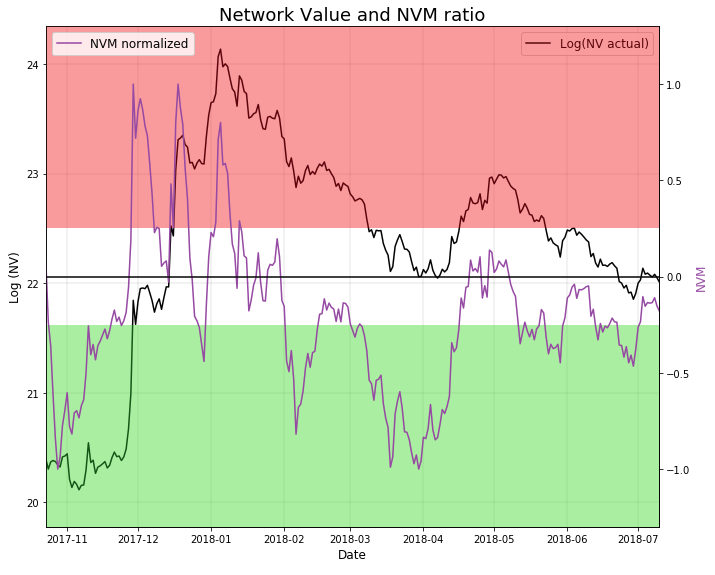
Ethereum
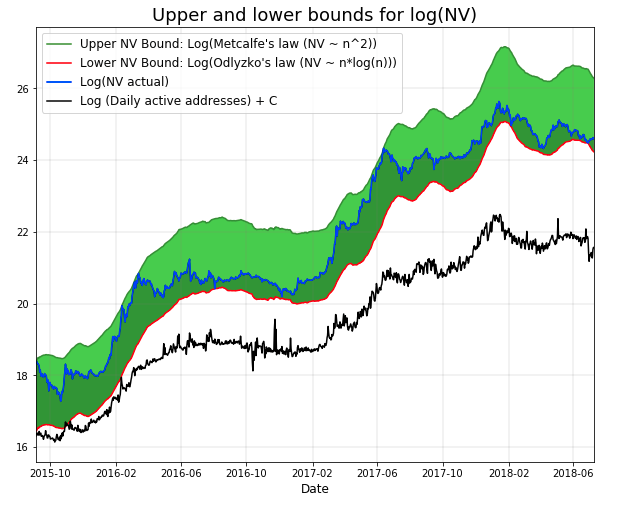
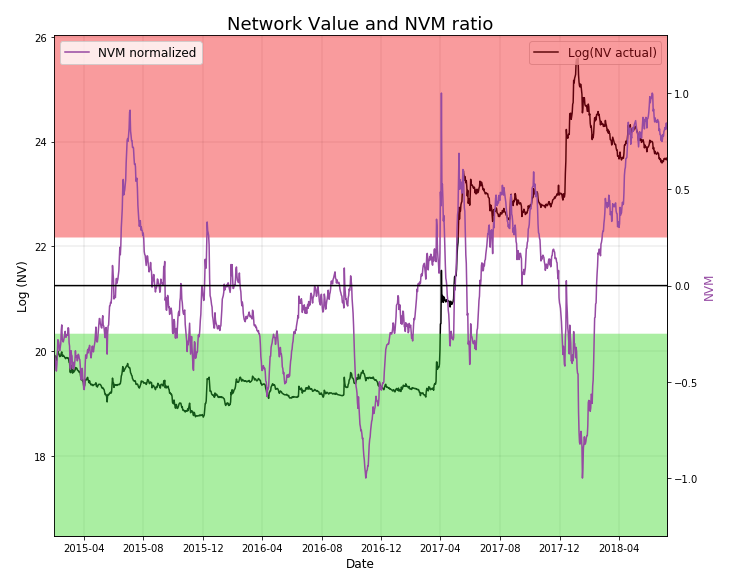
Currently, normalized NVM Ethereum values are touching the lower bound, which is related with the high use of the network relative to previous times, and the abrupt fall in ether prices since January. The analysis could be interpreted as a strong bullish signal.
Ripple
In the case of Ripple, the use of the network has hardly increased compared to previous use, but its market capitalization increased amazingly. Currently, it’s normalized NVM is deeply in the red zone.
EOS
EOS normalized NVM is currently close to zero after a slightly increase in the use of the network and a decline in its market capitalization, following a hype period prior to the mainnet launch.
Cardano
Cardano NVT value last months has kept mostly negative due to the abrupt fall of its market capitalization. Currently, with a consequent decrease of active users of the network, the NVT value approaches zero.
Stellar
Stellar market capitalization has increased surprisingly last year mostly due to hype and expectations, but the increased network value is slightly supported by network usability, which we can see in the first chart. The last chart shows a strong bearish signal.
Final words
The analysis presented on this article don’t intend to represent final blockchain valuations. The Metcalfe analysis is just one of a multiple valuation frameworks in which we are working. Feel free to send us your comments, ideas or suggestions.
If you liked this article, you might also like:
- A Review On Cryptoasset Valuation Frameworks
- Value at Risk & Expected Shortfall of Cryptocurrencies
- Cryptocurrency Investment Spreadsheet
- Emerging New Trends in Blockchain Technologies
- What I Have Learned From My Arbitrage Experiences with cryptoassets
Disclaimer: CoinFabrik does not provide financial advice. This material has been prepared for educational purposes only, and is not intended to provide, and should not be relied on for, financial advice. Consult your own financial advisors before engaging in any investment.